A Storied Past
CommScope has been tracking broadband bandwidth consumption for 12 years now. It is one of the longest-running projects of its kind in the industry. For consistency, we have been collecting bandwidth data from the same four North American MSO’s over this time. To get a good cross-section of the industry, these include both large Tier 1 operators as well as some smaller Tier 2 operators. Collectively, this data represents bandwidth consumption from 10’s of millions of broadband subscribers.
The data that we collect is the subscriber’s average bandwidth consumption during peak busy hour (a.k.a. Tavg). This is not to be confused with a subscriber’s service tier. The service tier defines the fastest burst rate allowed by that subscriber (e.g. 100 Mbps downstream by 10 Mbps upstream). Our Tavg consumption data is measuring the average of the actual broadband usage during peak periods. For broadband, peak consumption is typically measured between 9pm and 10pm although we saw some shifting in this pattern during the Coronavirus bandwidth surge. Together, Tavg and max service tier are the most important metrics for network capacity planning. These define what operators must engineer their networks to handle.
As we travel across the globe, we use this data as a benchmark to compare against every other operator. What we have found is that in developed countries everywhere – Asia to Europe to Latin America, all operators are showing bandwidth consumption that tracks very closely to these four yardsticks. In less developed countries, we have found that they may lag our yardsticks by a couple years, but they are still following the same bandwidth trajectory. This data gives us a true insight into what is happening with subscriber broadband consumption.
Roaring ‘20s begin with a Bang!
2020 was a year of massive change in the broadband world thanks to the pandemic. We had lots of anticipation to get our Jan ’21 numbers in so we could see how the long-term trends might be impacted.
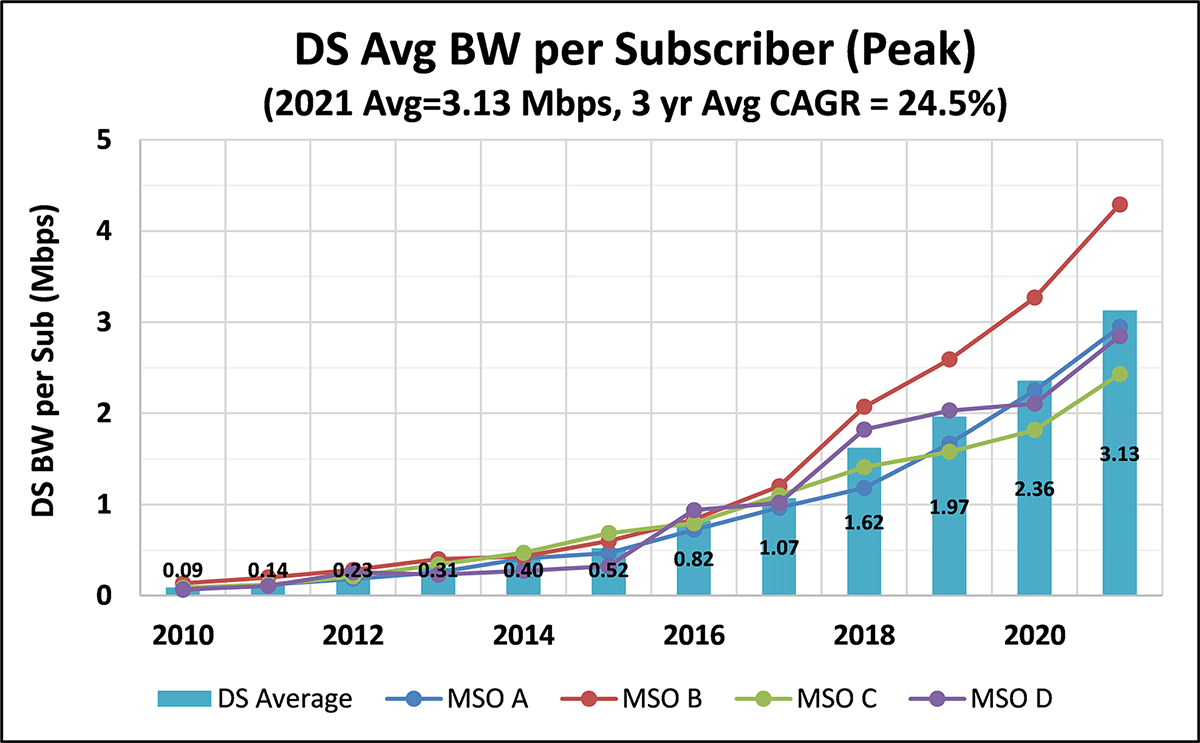
Let’s start with what we found with downstream (DS) bandwidth (BW) consumption. Our latest ’21 data is shown in Figure 1. The DS Tavg for the four MSOs grew by 32.5% year over year to 3.13 Mbps per subscriber. The individual MSOs varied from 2.4 Mbps to 4.3 Mbps. One MSO started to pull away from the pack a couple years ago and has maintained that difference. The 3-year compounded annual growth rate (CAGR) in the DS for all four has dropped to 25%. This continues a declining trend and is down from 30% last year. Individually, the four MSOs 3-yr DS CAGR varied from 16% to 36%.
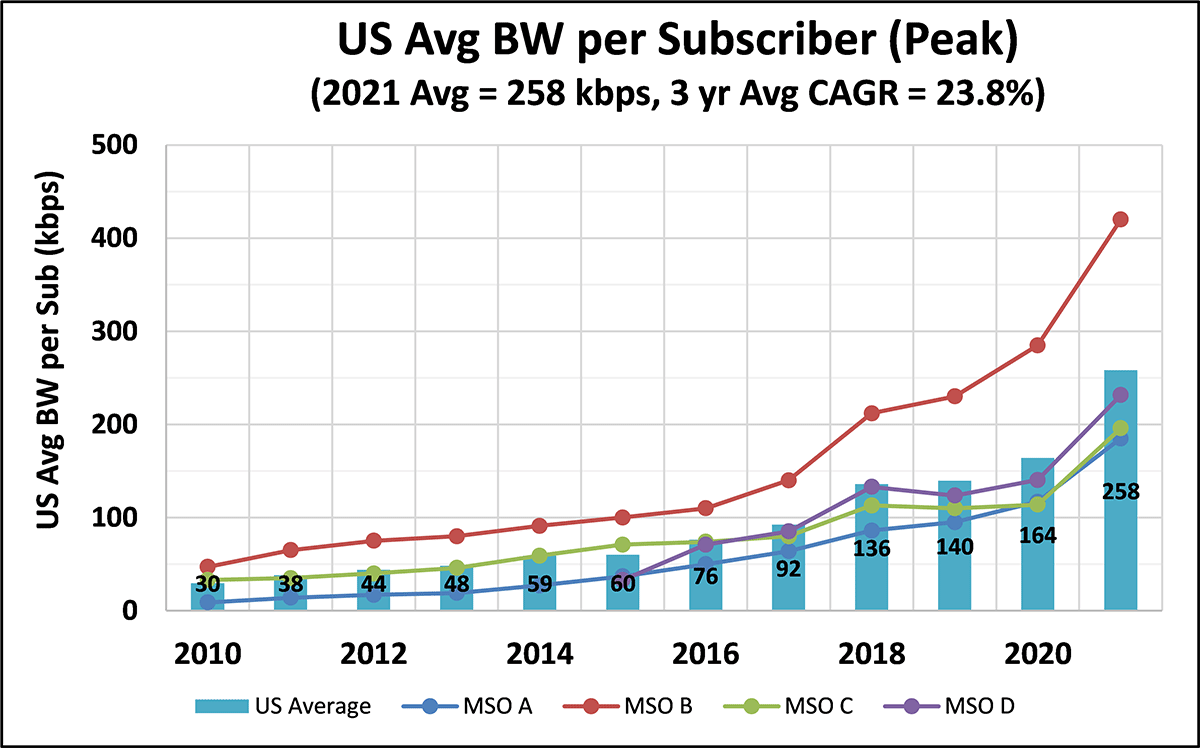
The latest ‘21 upstream (US) Tavg data is shown in Figure 2. The US Tavg for the four MSOs jumped by 57% year over year to 258 Kbps per subscriber. The MSO pulling away from the pack had an US Tavg equal 420 Kbps, roughly double the other three who were very close to 200 Kbps. The 3-year US CAGR was 24%. This is up slightly from last year and the first time that US CAGR has basically matched the downstream growth rates. Individually, the four MSOs 3-yr US CAGR varied from 20% to 29%.
Figure 1 – Average Subscriber Downstream Bandwidth consumption during Peak Busy period
Figure 2 – Average Subscriber Upstream Bandwidth consumption during Peak Busy period
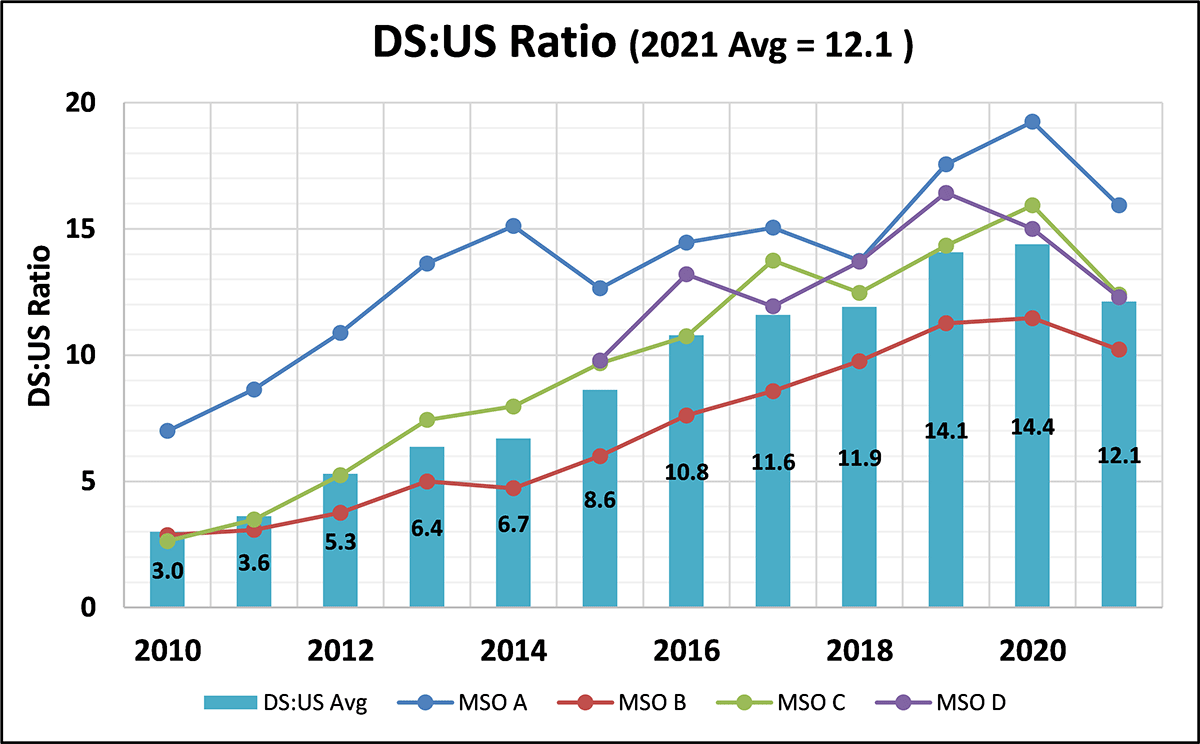
With a gigantic leap in upstream bandwidth consumption, what would be the impact on the DS:US Tavg ratio? The average DS:US ratio across the four MSOs is now about 12:1 as shown in Figure 3. This is a simple average across all four MSOs and is down a bit from 14:1 last year. Across the four MSOs, the DS:US Tavg Ratios range from 10:1 to 16:1. Again, down slightly from last year’s range of 12:1 to 19:1. Notice that every single MSO saw a double digit ratio – with downstream at least 10 times more than upstream average usage. This shows how DS bandwidth consumption still dominates, even in a pandemic world with many people working and learning from home.
Figure 3 – Downstream to Upstream Consumption Ratio over Last Decade
Future directions???
Post-pandemic, we believe that we will see a new normal, especially in the upstream. So, what are the implications going forward? Will upstream growth match downstream growth so we see DS:US ratio level off? Because the HFC upstream spectrum is much smaller than downstream, an increased US CAGR will pull forward the time needed to upgrade the HFC plant. This may include new technologies such as DOCSIS 4.0 Extended Spectrum (ESD) as well.
From a downstream perspective, we feel the Coronavirus BW surge gave a ~10% step increase to BW consumption and that we’ll see 20%-25% DS CAGR for the foreseeable future. It seems that the US BW consumption got something closer to a 30% pandemic step increase, but we see a similar 20%-25% US CAGR for the foreseeable future, not the chaotic 50%-75% jump seen in 2020. While this may be a new normal for US, we see US + DS roughly growing equally in coming years and hence we expect the asymmetric DS:US ratio should roughly stay in the 10:1 to 15:1 range going forward.
As we navigate the post-pandemic world, we’ll see if this new Roaring ‘20s decade can match the bandwidth consumption growth of this last decade.


